
Following the last three posts, we can now finish our exercise in creating a reliable, and ongoing, predictor of profitability.
Admittedly, for some, this can be a rather dry topic area.
Nevertheless, as we discussed in Solving the Profit Riddle, it is much, much simpler than the blackboard calculations in the photo, and it can bring great insight into the firm’s financial stability.
We’ve now forecasted the firm’s Net Fees (net revenues).
We’ve forecasted the firm’s Labor costs.
And we’ve forecasted our Expenses.
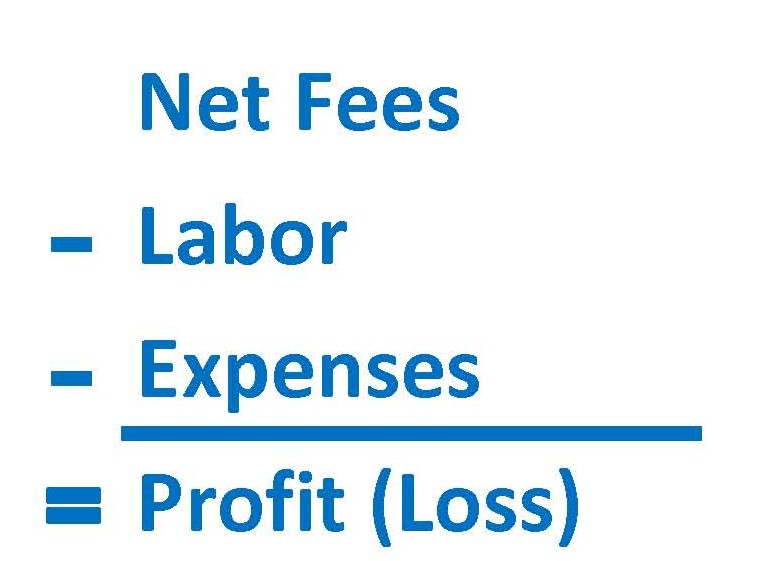
We’ve got all three necessary components of the basic profitability equation:
Using Excel, or some other simple spreadsheet tool, we can bring the three forecasts into a single summary document, which would look something like this:
![]()
We’ve simply brought the month-by-month totals for each of our 3 forecasts into a summary version, and created a “Profit Forecast” line at the bottom.
The formula for this bottom line is:
Net Fees – Labor – Expenses = Profit Forecast
And now we know where we stand, at least as of this moment. Of course, we are always working hard to generate more business and would expect that next month, we can update our Net Fee forecast to reflect any projected fees for new work.
Likewise, we can update our month-to-month numbers in our Labor and Expense projections. Particularly if we see any changes coming to our staffing or to our expenditures.
To stay current with our projections for the coming months, and to have some basis for decision-making, we really must keep this updated.
And, remember– as each month passes, we must go back and input the actual data from that month. This way, we keep our entire fiscal year in focus as we move through the months.
And that’s it.
Now we can see the future.
Happy fortune-telling!